Centre for Australian National Biodiversity
Research
|
Centre for Australian National Biodiversity
Research
|
Supervisor Dr Sophie Bickford
Biodiversity analysis has become an increasingly important field as ‘hotspots’ of diversity are now becoming a targeted priority for conservation planning and preservation of natural areas. Data for all of the Australian fern flora has recently been made available through the electronic databasing of herbarium collection records of Pteridophytes. This gives an opportunity for the analysis of continental scale patterns of fern diversity. There are over 400 species of Australian ferns, of various ages and evolutionary lineages.
Species distribution patterns results from a combination of physiological tolerances, geological and evolutionary history, as well as interactions with climate. These factors were taken into consideration in the investigation of fern species distributions across the Australian continent. This project was an exploratory analysis into the fern distribution patterns and highlighted areas for further investigation. As well as providing a quantitative analysis of fern diversity, results from the project demonstrated the utility of herbarium data sets for large scale biodiversity analysis.
The main aim of this research was to determine continental distribution and diversity patterns of ferns in Australia, and analyse these patterns with respect to current environmental conditions and evolutionary history, to generate a hypothesis for fern distribution across the continent.
This project was the first of its kind in exploring spatial fern data from herbarium records. Thus included in its scope was distribution mapping of all Australian fern species and an assessment of the scale at which such data can accurately represent actual distribution patterns. This would provide a basis to assess its potential for range determination using other methods, such as bioclimatic envelope modeling.
|
|
Constructing the spatial database
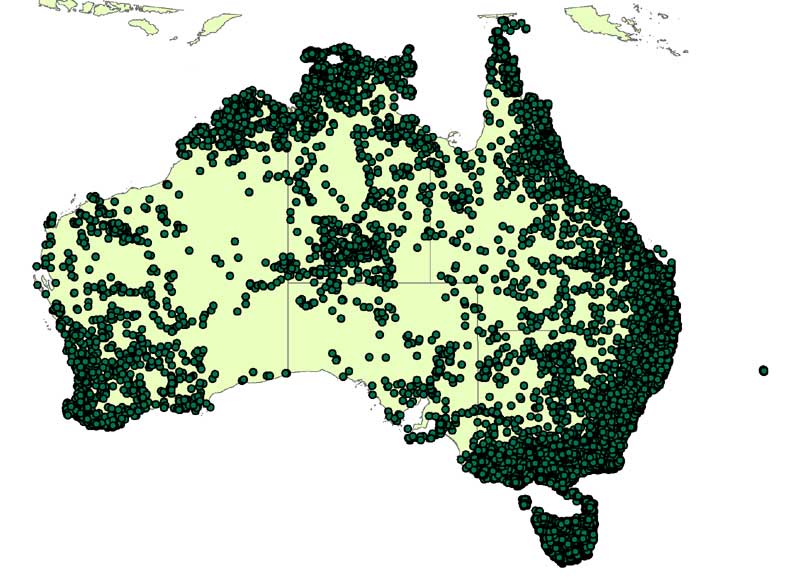
Herbarium specimen records from eight of the Australian herbaria were collated and validated. These herbaria were Darwin, Brisbane, QRS, New South Wales, Canberra, Melbourne, Hobart and Perth and in total approximately 50 000 fern and fern allied group records were collated and databased. These records were then edited and validated to give a satisfactory dataset for analysis. This included editing the dataset to identify records that were duplicated, of poor geographic accuracy and taxonomic misnomers (synonyms, spelling errors etc.). This data was then entered into a GIS (ArcMap) and further edited for geolocational errors based on known species distributions and tolerances as described by fern experts*. The final edited dataset totaled around 40 000 records of 455 different fern species. Figure 1 shows all the records of fern collections that were used for the dataset. (*David Jones, Australia National Herbarium).
Spatial analysis of species richness, areas of endemism and biotic regions (areas with shared groups of species) were undertaken on this data by using a 50 X 50 km grid across the continental range and each cell (2500 km�) was analysed based on the species components.
Species richness and endemism
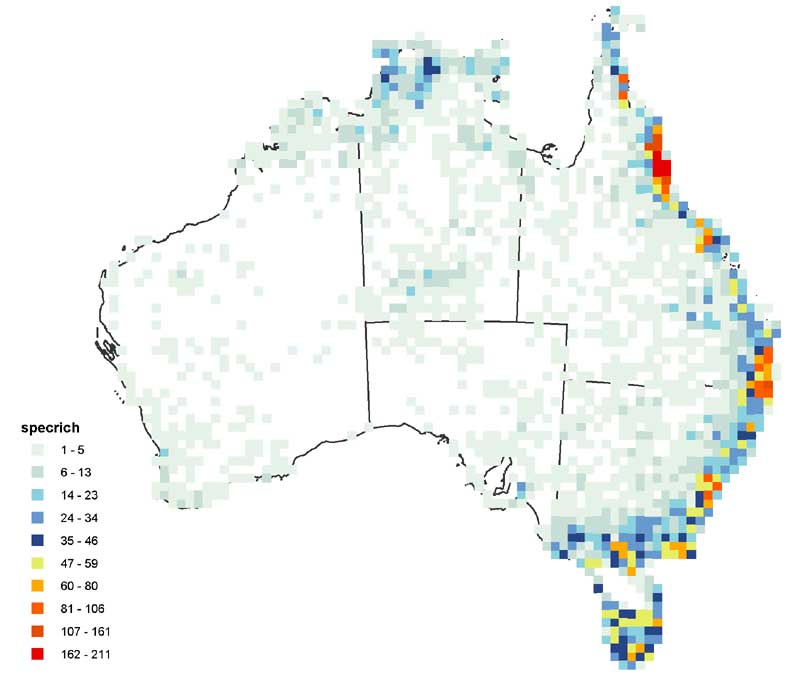
Species richness was calculated as the total number of different species in each cell. Counts ranged from 0 to 211 as a maximum count in the wet tropic region of Queensland (Figure 2). Areas of high species richness were identified as: Cape York (90*), Wet tropics (211*), Border Ranges (130*), Sydney (90*), Eastern Victoria (70*), Tasmania (65*) (Figure 2). (*maximum cell species richness count in cells of that area). Although we did not quantitatively analyse climatic relationships with species richness, there appeared to be a strong positive correlation with moisture availability and species richness.
Endemism was used to investigate the range restriction of species and to identify centres of endemism, and the data was analysed at different spatial scales for this. Endemism was calculated as Correct Weighted Endemism, the inverse of the range of a species summed for a cell over the total number of species in a cell. This was calculated at increasing spatial resolutions, using a increasing radius cell neighbourhood approach, so that localised areas endemism could be identified and compared to regional patterns. Cape York and the wet tropics appeared as areas of high endemism at the smallest scale. The south west of Tasmania was observed as an area of high endemism at a smaller scale, whereas all of Tasmania came up as an endemic area on a larger scale analysis. Figure 3 shows areas of endemism at the 3 cell radius scale of analysis.
|
|
|
Biotic regions
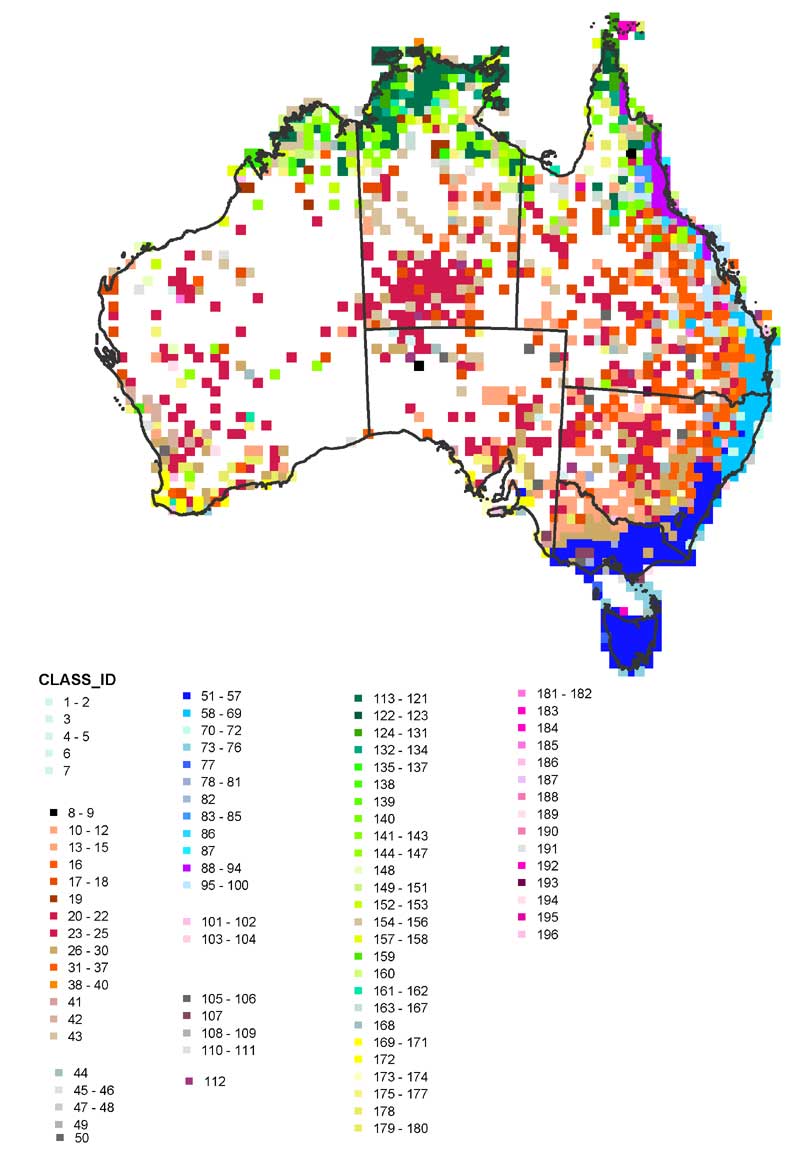
Areas with similar groups of species were determined using similarity analysis and a hierarchical classification process based on the species complements of each grid cell. Although further exploration of the species composition of these regions is required to fully analyse correlation patterns in distributions, from a preliminary analysis there appeared a strong correlation between fern distribution patterns and climatic zone distributions based on rainfall, humidity and temperature. Centres of endemism also appeared correlated with the different climatic regions. There was also an apparent connection with the southern group of fern flora and New Zealand species. Figure 4 presents the regions of similar species complements across the continent.
|
|
Evolutionary exploration
It was apparent that climatic gradients would not explain the totality of fern distribution across the continent and exploration into the question of whether there are remnant distribution patterns reflecting evolutionary histories.
The ferns were divided into two evolutionary groups; the Eusporangiate and Leptosporangiate groups. Species richness and endemism performed on distinctive groups. Correlation analysis indicated that there was no difference between distribution patterns of richness or endemism in the two groups, and this may be a result of the division having occurred very early in their evolutionary history. The ancient history of ferns have led to speculation that remnant Gondwanan patterns may still be apparent in their distribution. Despite searching the biogeographic, phylogenetic and palaeoecological literature we were unable to identify ‘Gondwanic’ elements at a relevant classificatory level from more modern elements, prohibiting separate spatial analysis of ‘Gondwanic’ elements.
|
|
Further exploration: Species range modelling
A preliminary investigation of the potential of BIOCLIM (ANUclim package) to
predict fern species distribution from the dataset was undertaken. The results
indicate that there is a potential for this method to predict fern distributions,
although modifications to data and prediction accuracy are needed.
(see figure 5)
This project successfully produced the first quantitative analysis of large scale patterns of fern distribution in Australia. As yet this analysis is considered preliminary, however it identified both patterns of distribution, in terms of species richness, endemism and fern species regions, as well as areas for further investigation. The data is still in need of further editing and analysis in terms of accuracy of records and analysis for distribution and collection density with regard to biodiversity. However the dataset was concluded to be appropriate for a continental scale approach to biodiversity analysis, but for smaller scale analysis a more comprehensive assessment of record accuracy would be required.
From preliminary analysis there appears a strong association between fern distribution and climatic gradients across the continent. Further investigation would give greater insight into the species patterns and centres of endemism and the factors contributing aside from environmental influences.
I would like to sincerely thank my supervisor, Dr Sophie Bickford (CPBR) for providing such a great experience, David Jones (CPBR) and Jim Croft (ANBG) for their assistance, advice and inspiration, Kim for his help in creating such a huge database, Shaun Laffan (University of Sydney) for his assistance in analysis and finally CPBR for providing the opportunity for me to participate in CSIRO research.
This work would not have been possible without the specimen record data provided by the Australian National Herbarium, the National Herbarium of New South Wales, the National Herbarium of Victoria, the Queensland Herbarium, the Western Australian Herbarium, the Northern Territory Herbarium and the Tasmanian Herbarium. Their involvement is gratefully acknowledged.
Barrington, D.S., (1993), Ecological and historical factors in fern biogeography, J. Biogeography, 20: 275-280
Bureau of Flora and Fauna (1998), Canberra, Flora Of Australia, Vol. 8. Ferns, Gymnosperms and Allied Groups, Australian Govt. Pub. Service.
Crisp, M.D., Laffan, S., Linder, H.P, and Monro, A. (2001), Endemism in the Australian Flora, Journal of Biogeography, 28: 183-198.